


Atmosphere and Vegetation, Changes to Land Use (Deforestation, Urbanization and such)
A vast amount of research is being conducted concerning the role of vegetation in climate formation, related to topics such as the planet's atmospheric composition and precipitation level distribution on a continental scale. Here I explain the impact of vegetation on local weather conditions by focusing on the changes in land usage by humans. Land cover alteration accompanying human activity can be divided into the following categories: (1) Vegetation cover control (deforestation, farmland development, afforestation, anthropogenic forest fires, etc.), (2) Water cycle control (dispersion of river water and ground water, etc.), (3) Animal control (grazing, etc.), and (4) Construction of man-made objects (urban development, harbor landfill, etc.). The following two points may be considered the impacts the above-mentioned human activities have on climate. The focus will be given on the effect B, as experiments using a numerical model are introduced.
- Changing Water and Physical Cycles
(Ex.) Because asphalt surfaces have low water-retention capacity, rainfall is carried swiftly to rivers. However, in forests, it is captured by leaves and absorbed through the soil into groundwater, thus flowing into rivers gradually. Moreover, forests suppress landslides and material outflow and absorb atmospheric carbon. In cities, exhaust gas and microparticles are emitted from factory smokestacks. - Changing Distribution of Energy
(Ex.) Because the color of the earth's surface (Albedo) changes when land coverage changes, the amount of absorbed solar radiation is affected. Moreover, air temperatures increase in dried urban regions because the energy in water evaporation cannot be harnessed. In forests, on the other hand, temperature increases are restrained because water absorbed through the roots of vegetation evaporates (transpires) through the leaves. The water cycle given in the above example is understood to be related to energy distribution.
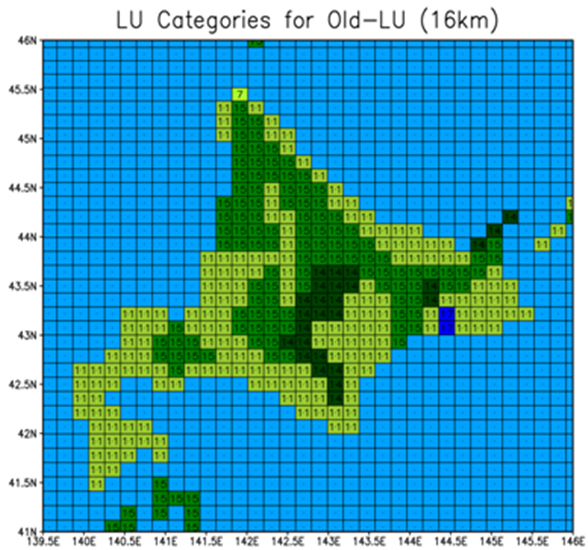
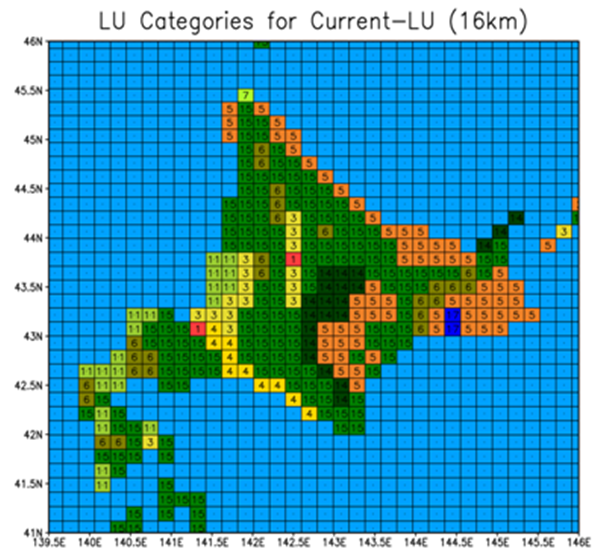
Land use in Hokkaido has changed greatly accompanying settlement since the Meiji period. Figure 1 is a classification map of past (around 1850) and present (1985) land use. Prior to settlement, Hokkaido was covered in forest, but since the land was settled, forested area has greatly diminished due to the expansion of agricultural land and urbanization. These two land use distributions are each used as regional weather model (note 1) boundary conditions in conducting dual climate reconstruction experiments for Hokkaido. Since the climatic differences which appear in the results of the two experiments originate solely from land use conditions, the impact from the change in land use from past to present can be examined (Note 2)
|
|
|
Figure 1 : Land use distribution in pre-settlement (left: around 1850) and post-settlement (right: around 1985) Hokkaido. Green is forest, brown is farm fields, yellow is rice paddies, and red represents urban areas. |
|
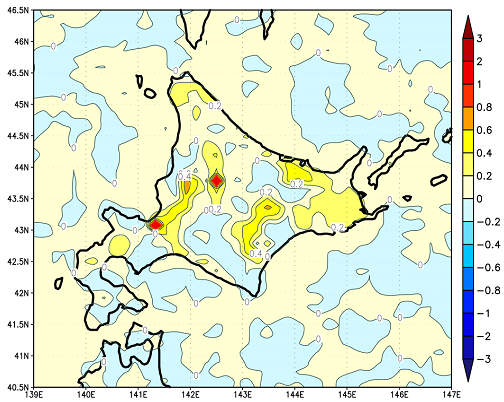
The left part of Figure 2 indicates temperature differences between the two experiments. Spring day minimum temperatures in the urban regions of Sapporo and Asahikawa show very large increases. This increase is likely caused by greater ease of heating the ground surface due to decreased evapotranspiration resulting from deforestation and urban development, as well as heat emissions accompanying human activity (anthropogenic waste heat). Moreover, from temperature increases observed in the Tokachi plain and Nemuro area, in addition to Uryu and Ishikari river regions, it is understood that temperatures increase in areas converted from forest to farmland and rice paddies.
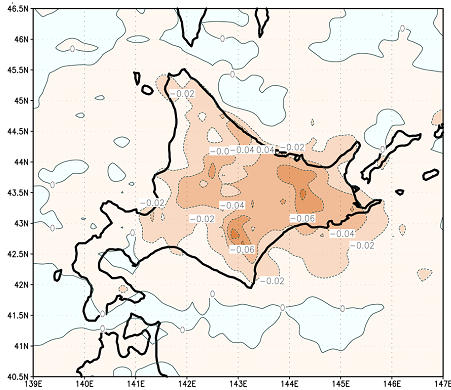
The impact corresponding to this change in land use is generally very small when averaged over all regions of Hokkaido. But it is clear that there is an impact that cannot be ignored in regions where land use was modified. As forests disappear, atmospheric moisture also decreases due to the decrease in evapotranspiration as stated above (Figure 2 right). As a result, it can be predicted that rainfall will be impacted in some way. But since rainfall is intimately linked with factors other than land use, such as mountainous terrain and low pressure channels, it is difficult to identify these effects. Further research is necessary.
|
|
|
Figure 2 Change in spring minimum temperatures associated with land use change (left figure) and change of summer precipitable water level. In the left figure, red and yellow indicate regions where temperatures have increased, and in the right figure, brown indicates areas where precipitable water levels have fallen. Precipitable water level is a value of atmospheric water vapor integrated in the height direction from ground level. |
|
Commentary relevant to this research can be viewed at http://www.msj-hokkaido.jp/kaki/kaki2011sato.pdf.
Note 1: Software which computationally solves equation systems, which are formulated based on physical laws, in order to calculate time variables of air temperature, wind, and other weather factors is called a climate model or a weather model. Regional weather models can calculate a subject area with high spacial resolution and are being developed by various domestic and international research institutions. In the research introduced here, a model developed in the United States called WRF (http://www.wrf-model.org/index.php) is used.
Note 2: The structure of the model used here is set up to express the interaction between atmosphere and land: “The drier the atmosphere (or the wetter the oil), the more water evaporates and transpires from the earth's surface (ground surface, vegetation)”; “If precipitation levels are high, water in the soil increases”; and “ The darker the color of the earth's surface, the more solar radiation energy is absorbed.” In general, the strength of this interaction can be explained using a variety of parameters, such as the albedo reflection rate, evaporation efficiency, and roughness length of the earth's surface, and so on. The effect of land use can be expressed because these types of parameters are configured to correspond to several representational land use forms (forest, grassland, rice paddy, urban area, etc.) in the model.